


Between 20% and 60% of users churn after their first session with a product. I had to read that number twice. Not after a month. Not after a quarter. After a single session, up to six out of ten people decide they've seen enough and leave.
The numbers in this issue come from product people who got tired of watching dashboards turn red and decided to do something about it. They are not retention consultants selling frameworks. They are practitioners who opened their spreadsheets and shared what they found.
I think about this stat every time I see a startup announce a huge funding round alongside a user acquisition number. The number always goes up. The retention number is never mentioned. There is a reason for that, and it is not flattering.
Brought to you by ExecReps.ai, AI-powered executive presence coaching for teams.
Product Coalition is a reader-supported publication. To receive new posts and support my work, consider becoming a free or paid subscriber.
The Sign-Up Is Not the Win
I spent an hour last week trying to unsubscribe from a meal kit service that I signed up for during a moment of late-night ambition. It took four clicks and a forced survey just to stop the boxes from arriving at my door. I sat there watching the screen and realised that I was just another data point in a very expensive game of musical chairs.
Ant Murphy captured this distinction perfectly in Acquisition vs Activation and How to Predict Churn. He writes: 'Acquisition is when you get a user on board. Activation is when you get them to use your product in a meaningful way.'
I wonder how many product teams confuse those two moments. Ant asks a question that I find genuinely uncomfortable: 'Just think how many things have you signed up for and never used?' I look at my own phone and see at least a dozen apps gathering digital dust. Every one of those was someone's acquisition metric. None of them became an activation story.
He had a FinTech client whose mobile team was tracking daily active users as their core metric. His challenge to them: 'How often do you look at your bank account? Do you check your app every day? I don't.' They were measuring engagement on a cadence that did not match how people actually use banking products. The number looked good on a dashboard. It meant almost nothing.
His advice is the bit that stays with me: 'Don't just track acquisition, activation and retention. Track the nuanced states between each of them.' The space between active and churned is not a cliff. It is a slow, quiet drift that most dashboards are not designed to show you.
The 90% Problem
If you ignore those nuances, you end up fighting a war you cannot win. The team at UXCam laid out the stakes in How to Measure, Analyze, and Reduce App Churn: 'All the user acquisition in the world won't matter if you've got a high churn rate on your app.'
It is a simple truth that most teams acknowledge and then proceed to do nothing about. They also note that 'it's generally much easier to retain customers than it is to gain new ones.' Everyone nods at this in meetings. Very few teams actually resource retention work the way they resource acquisition campaigns.
The statistic that I keep coming back to from their piece: 90% of users have stopped using an app due to poor performance. Not missing features. Not bad pricing. Poor performance. The app was slow, or it crashed, or the thing they wanted to do took too many steps. Product teams obsess over building the next feature while the foundation is cracking under their feet. I suspect that fixing a slow loading screen is often a better investment than building a new dashboard, but that fix never makes it into the quarterly roadmap presentation because it is not exciting enough.
The Unicorn Graveyard
Nick Chasinov puts the human cost of this in focus in User Retention Defines Your Product's Success: Here Are 3 Ways to Improve It. He mentions that 'the number of users who churn in the first session ranges from 20% to 60%.' That is the stat I opened with, and it is a sobering thought for anyone whose job depends on growth.
He also cites research showing that 'improving retention by just 5% can boost revenue by 25% to 95%.' A five percent improvement. Not a rebuild. Not a pivot. Five percent less leaking from the bucket.
The examples he picks are the ones that should keep product leaders up at night. Fab, the design e-commerce site, 'was valued as a unicorn and raised a $336 million funding round prior to closing its doors.' Homejoy, the home services platform, raised almost $40 million and shut down 18 months later. Both grew fast. Neither retained.
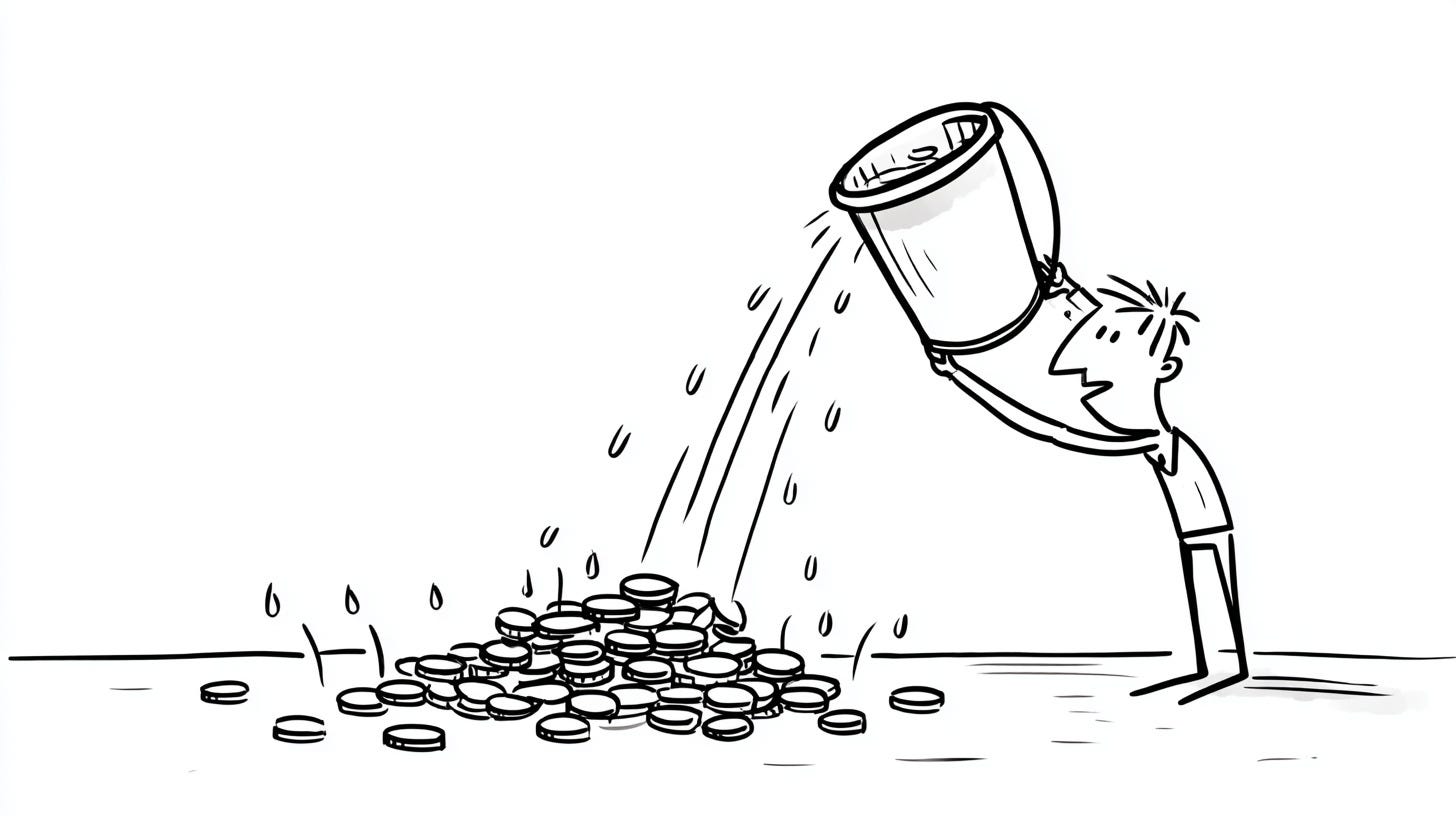
His framing is the one I wish more product teams would internalise: 'It's easy to show investors top-line growth, such as gaining 100,000 new users in a week, but retention paints a more accurate picture of long-term success.' The leaky bucket looks full if you keep pouring water in fast enough. It is still leaking.
Putting a Number on the Leak
If you want to move this from philosophy to action, Scott Middleton provides a framework in How to Calculate the Value of Your Retention Improvements. He acknowledges upfront that 'calculating the return on investment of improvements to retention can seem like a daunting or complex task.'
His approach is deliberately simple: take your churn rate, multiply it by the number of customers, and multiply that by your lifetime value. The number you get is what churn is costing you right now. I find this math useful because it removes the emotion from the room. It turns a product problem into a business reality that a CFO can understand and act on. No philosophical debates about user experience. Just a number on a spreadsheet that says 'this is what we are losing every month because people leave.'
The simplicity is the point. Scott argues that without a clear and uncomplicated formula, your calculation would get caught up in sensitivity analysis and endless debates about the inputs. Most retention initiatives die not because they are bad ideas but because nobody could agree on how to measure whether they worked.
The Ratio That Matters Most
Nick Chasinov returns in Why Are Customer Acquisition Cost and Lifetime Value Important to Calculate? to explain the core tension that sits underneath all of this. He states that 'the money, time, staffing, and other resources used to acquire a new customer must be lower than that customer's lifetime value for the business to be successful.'
He suggests aiming for a 3-to-1 ratio between lifetime value and acquisition cost. If it costs you $1,000 to acquire a customer, you need at least $3,000 in lifetime value to have a sustainable business. I find this useful as a North Star because it forces product and marketing teams to have the same conversation instead of optimising in opposite directions.
The detail that landed hardest for me: '93% of people trust friends and family to obtain information about services and brands, while only 30% of consumers trust companies.' If you focus on retention, on making the product so good that people actually stay and tell others about it, you build the best acquisition channel that exists. Not an ad campaign. Not a growth hack. A product worth talking about. That is the cheapest customer acquisition cost there is, and the one least likely to show up in your marketing budget.
The Question I Keep Asking Myself
When I look at the products I have worked on, the honest answer is that I spent far more time on acquisition than retention. Most of us do. New users are exciting. Churned users are depressing. It is easier to celebrate a sign-up than to investigate a cancellation. But the math does not care about what is more fun to work on.
The practitioners I have quoted in this issue are not writing from corner offices. They are product managers, founders, and consultants who sat down and worked through the numbers because they were tired of watching their buckets leak. That is what Product Coalition exists for. Not the view from the top, but the lessons from the people doing the work.
When you look at your own product, are you spending more time trying to plug the holes in the bucket, or trying to find a bigger hose to fill it?
You're reading the Product Coalition newsletter. Every week, I dig into the archive of 3,500+ articles and 100+ podcast episodes to trace how product thinking has evolved. If someone forwarded this to you, subscribe here so you don't miss the next one.
Got a product story worth telling? Whether you're an exceptional talent shaping the future of product, or you've got a career journey others can learn from, I want to hear from you. Apply to be a guest on the Product Coalition podcast.
👋 Jay
Sources
Ant Murphy, Acquisition vs Activation and How to Predict Churn (Apr 2023); UXCam, How to Measure, Analyze, and Reduce App Churn (Jun 2022); Nick Chasinov, User Retention Defines Your Product's Success: Here Are 3 Ways to Improve It (Nov 2022); Scott Middleton, How to Calculate the Value of Your Retention Improvements (Mar 2022); Nick Chasinov, Why Are Customer Acquisition Cost and Lifetime Value Important to Calculate? (Jun 2023)