


Brought to you by ExecReps.ai, AI-powered executive presence coaching for teams.
Every product I have ever managed has bled customers. The product was usually fine. The team was looking in the wrong direction.
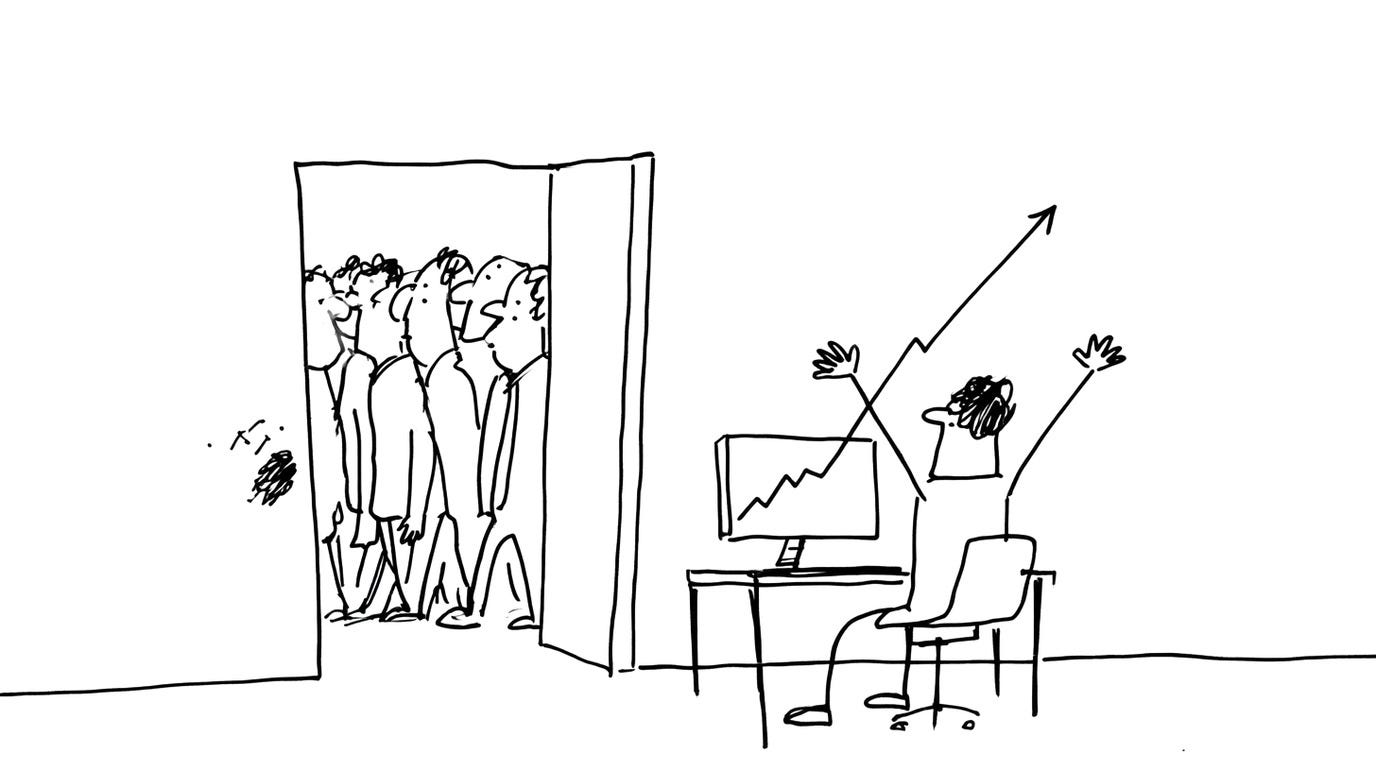
The dashboards showed acquisition. The team celebrated sign-up spikes and ran victory laps on numbers that mean very little if nobody stays past day three. That pattern has repeated for twenty years, across companies, continents and product categories.
The leak is always between sign-up and the first real use.
"Acquisition is when you get a user on board. Activation is when you get them to use your product in a meaningful way." Ant Murphy, writing in Product Coalition
Sign-ups Are Not Wins
Ant Murphy draws the line I have drawn in a hundred boardrooms, and most teams I advise collapse the two sides of it into one number. A sign-up gets counted as a win, when all it records is a maybe.
Ant asks something I have put to product teams for years: "just think how many things have you signed up for and never used?" For most honest people the answer runs into dozens.
He describes a FinTech client tracking daily active users as their north star. His challenge lands hard. "how often do you look at your bank account? Do you check your app every day? I don't."
That mistake turns up everywhere once you know its shape. Teams measure success against a behaviour their customers never perform, then wonder why the retention curve flattens. It is a comfortable delusion, and comfortable delusions survive a long time.
Then comes the fix, and in twenty years no team has proposed it to me unprompted. "Don't just track acquisition, activation and retention. Track the nuanced states between each of them."
The user who signed up and never finished onboarding. The user who activated once and vanished. The user who stayed active a fortnight and then went quiet.
Each transition is a different problem with a different fix. Lumping them together under churn is lazy, and it buries the one thing you could have acted on.
So instrument them separately. Signed up and never activated. Activated once and never returned. Returned for a fortnight and then stopped. Then the quiet decline that shows up as falling frequency rather than a cancellation.
Those are four different conversations, and they rarely belong to the same owner.
The Ratio That Decides Everything
Nick Chasinov states the arithmetic without decoration: "the money, time, staffing, and other resources used to acquire a new customer must be lower than that customer's lifetime value for the business to be successful. If your CAC is higher than your LTV, it's only a matter of time before the business closes its doors."
I have sat in leadership meetings where CAC was treated as something finance worried about. It belongs on the product team's wall.
Nick cites the benchmark most of us carry around: "It's best to aim for a 3-to-1 ratio. For instance, if it costs a company $1,000 to acquire a customer, it would want its lifetime value to be at least $3,000."
Treat that as a rough heuristic rather than a law. Andreessen Horowitz describes 3x as a benchmark investors reach for, and it shifts with margin, payback period, and how you calculate lifetime value in the first place.
What the ratio buys you is margin for error. Sitting near one-to-one means a single bad quarter puts you underwater, or one spike in support costs does it instead.
A word of caution here, because this genre is stuffed with numbers that fall apart when you check them. The line you have seen everywhere, that a five percent lift in retention grows revenue by 25 to 95 percent, is a misquote. Reichheld and Sasser said profits, and they said it in the Harvard Business Review in 1990.
The direction of travel still holds. Treat it as a direction rather than a forecast for your business in 2026, and stop repeating the version with revenue in it.

Making Retention Legible to Finance
Scott Middleton takes on the part that quietly kills most retention work. He admits that "Calculating the return on investment (ROI) of improvements to retention can seem like a daunting or complex task."
It can, and that complexity is exactly why retention loses budget fights to flashier acquisition campaigns.
Scott's answer is to keep the formula boring. "Without a clear and uncomplicated formula, your calculation would get caught up in sensitivity analysis and endless debates about the inputs."
His method runs in two steps. Monthly churn cost is your churn rate multiplied by your customer count, multiplied by CLV. Annual cost is that monthly figure multiplied by twelve.
Put real numbers against it. Ten thousand customers, three percent monthly churn and a CLV of £900 means you lose 300 customers a month. That is £270,000 of value leaving every month, and £3.24m across the year.
Now take a piece of retention work that moves churn from three percent to two and a half. Half a point sounds like nothing in a roadmap review. It is £540,000 a year, which is a senior hire and most of a squad.
I use that framing whenever I build the case for retention work. Translate a retention improvement into money kept and the conversation changes shape. A five percent reduction in churn stops being a nice-to-have and starts appearing on the P&L.
Product leaders who cannot make that translation lose the prioritisation argument to the growth team every time.
History has receipts. Fab reached a billion dollar valuation and raised somewhere between $310m and $336m across multiple rounds before its 2015 fire sale. Homejoy raised around $40m in total and closed on 31 July 2015, roughly nineteen months after that funding was announced.
Both grew quickly. Neither built a product people came back to. Growth without retention is a bonfire, impressive to look at and gone by morning.
What I'm Hearing on the Podcast
Andrea Bronzini spent eight years inside experimentation at CXL and Speero, then walked away because he had decided the industry was optimising for the wrong thing. He showed me a simulation of one experiment run over and over.
"The real conversion rate is 3%, but what you measure at day 28 is 3.5." Run it again and a different path appears, then another, until you are looking at a wide cloud of possible answers.
Then he named the mistake. "One mistake I see teams making is that they look at the conversion rate they have measured, and they take that for granted. But the uncertainty is more important than the point conversion rate."
That line has stayed with me since we recorded it. The number on your dashboard is a sample that happens to be today's, and CLTV is harder to fool because it needs time to accumulate. Somebody has to keep paying, month after month, before it moves at all.
CLTV has its own failure modes, and a generous enough time horizon flatters almost any cohort. It is still the last number I would give up.
So What Does This Mean for You?
Two decades in product have taught me that CLTV is the most honest metric available. It ignores your press coverage, your sign-up chart, and how elegant the onboarding looks in a demo. It measures whether the thing you built matters enough for someone to keep paying for it.
The practical move this week is small. Pull your retention curve, find the point where users stop coming back, and price that drop-off using Scott's two-step calculation. You will have a number finance recognises, which is what turns a retention argument into a funded one.
Then the harder question, and it is the one I want to put to you. Which of the metrics your team reported last month would survive being checked as carefully as your CLTV?
Reply and tell me. I read every one.
Got a product story worth telling? Whether you're an exceptional talent shaping the future of product, or you've got a career journey others can learn from, I want to hear from you. Apply to be a guest on the Product Coalition podcast.
👋 Jay
Product Coalition is a reader-supported publication. Paid subscribers get every issue on the day it lands.